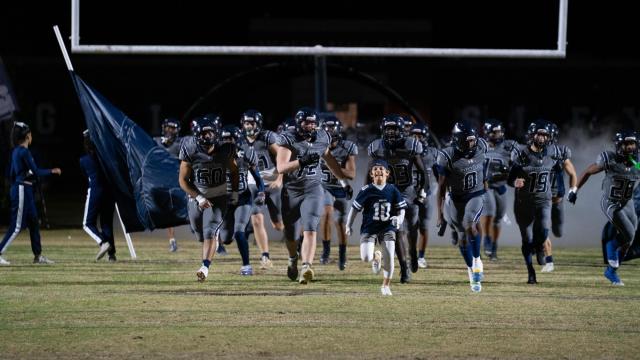
For the first time since the 2017-2018 school year the NCHSAA has reported that 208,722 students participated in sports for the 2023-2024 school year.
This was the third-highest participation in any given school year in the NCHSAA’s 100 year history.
That is up from 198,025 during the 2022-2023 school year, and is the highest figure since the 2013-2014 school year when 214,046 student-athletes were participating in high school sports in North Carolina.
Every single sport saw growth in participation last school year with one exception: baseball. Despite five additional schools offering the sport in the spring, there was a decline of 153 student-athletes playing baseball — down from 10,727 in 2023 to 10,574 in 2024. A total of 414 schools played baseball this spring.
Click Here to Read More About NCHSAA Participation Growth
2022-2023 VS 2023-2024 Sport Participation by the Numbers
Fall Sports
73,777 total participants
Boys Cross Country: 5,821 participants, 395 schools (+510)
Last Year: 5,311 participants, 385 schools
Boys Soccer: 12,916 participants, 407 schools (+1,100)
Last Year: 11,816 participants, 402 schools
Football: 29,075 participants, 383 schools (+1,266)
Last Year: 27,809 participants, 382 schools
Girls Cross Country: 4,279 participants, 382 schools (+195)
Last Year: 4,084 participants, 377 schools
Girls Golf: 1,573 participants, 282 schools (+169)
Last Year: 1,404 participants, 270 schools
Girls Tennis: 4,318 participants, 340 schools (+312)
Last Year: 4,006 participants, 337 schools
Spirit: 9,776 participants, 386 schools (+208)
Last Year: 9,568 participants, 382 schools
Volleyball: 10,303 participants, 432 schools (+524)
Last Year: 9,779 participants, 427 schools
Winter Sports
55,964 total participants
Boys Basketball: 11,409 participants, 434 schools (+166)
Last Year: 11,243 participants, 431 schools
Boys Indoor Track: 7,331 participants, 304 schools (+833)
Last Year: 6,498 participants, 290 schools
Boys Swimming: 3,338 participants, 305 schools (+35)
Last Year: 3,303 participants, 300 schools
Boys Wrestling: 9,885 participants, 342 schools
Data for wrestling was not separated between boys/girls in 2022-2023
Cheerleading: 9,709 participants, 414 schools (+1,628)
Last Year: 8,081 participants, 354 schools
Girls Basketball: 7,663 participants, 429 schools (+193)
Last Year: 7,470 participants, 425 schools
Girls Indoor Track: 5,912 participants, 306 schools (+836)
Last Year: 5,076 participants, 285 schools
Girls Swimming: 4,487 participants, 306 schools (+182)
Last Year: 4,305 participants, 304 schools
Girls Wrestling: 1,432 participants, 248 schools
Data for wrestling was not separated between boys/girls in 2022-2023
Spring Sports
68,284 total participants
Baseball: 10,574 participants, 414 schools (-153)
Last Year: 10,727 participants, 409 schools
Boys Golf: 3,278 participants, 371 schools (+216)
Last Year: 3,062 participants, 371 schools
Boys Lacrosse: 4,219 participants, 121 schools (+243)
Last Year: 3,976 participants, 118 schools
Boys Tennis: 3,833 participants, 319 schools (+83)
Last Year: 3,750 participants, 314 schools
Boys Track: 15,932 participants, 408 schools (+21)
Last Year: 15,911 participants, 408 schools
Girls Lacrosse: 2,726 participants, 101 schools (+26)
Last Year: 2,700 participants, 99 schools
Girls Soccer: 10,507 participants, 396 schools (+343)
Last Year: 10,164 participants, 389 schools
Girls Track: 11,409 participants, 409 schools (+343)
Last Year: 10,164 participants, 389 schools
Softball: 7,017 participants, 402 schools (+105)
Last Year: 6,912 participants, 398 schools


